Concentration of general needs housing stock rises
An exclusive special report by Social Housing shows that housing associations’ general needs stock is becoming more concentrated within their local authority areas
Sharelines
General needs stock held by housing associations across the country is becoming more concentrated within their local authority areas.
An exclusive special report by Social Housing shows that there were an average of 578 general needs units per local authority area in 2018, compared with 539 in 2015, when this report began.
At the same time, the average number of local authority areas held by registered providers (RPs) has remained relatively flat at 21 this year, compared with 20 in 2015, while the total number of RPs has significantly decreased to 165 from 180 in 2015.
General needs excludes supported housing and housing for older people. It includes general needs homes rented at both social (about 50 per cent of market rent) and affordable (up to 80 per cent of market rent) levels.
The figures were compiled from the Statistical Data Return for 2017/18 and focus on RPs with general needs stock of 2,500 units or more.
Although each housing association (HA) clearly has its own unique portfolio strategy, the research gives an indication of the extent to which organisations are rationalising and consolidating their stock as they move to become more efficient and improve tenant services.
Summary of RPs’ presence in local authority areas, 2017/18
| Size band of general needs units* | Number of RPs** | Average number of general needs units per RP | Average number of local authorities | Average number of general needs units per local authority |
|---|---|---|---|---|
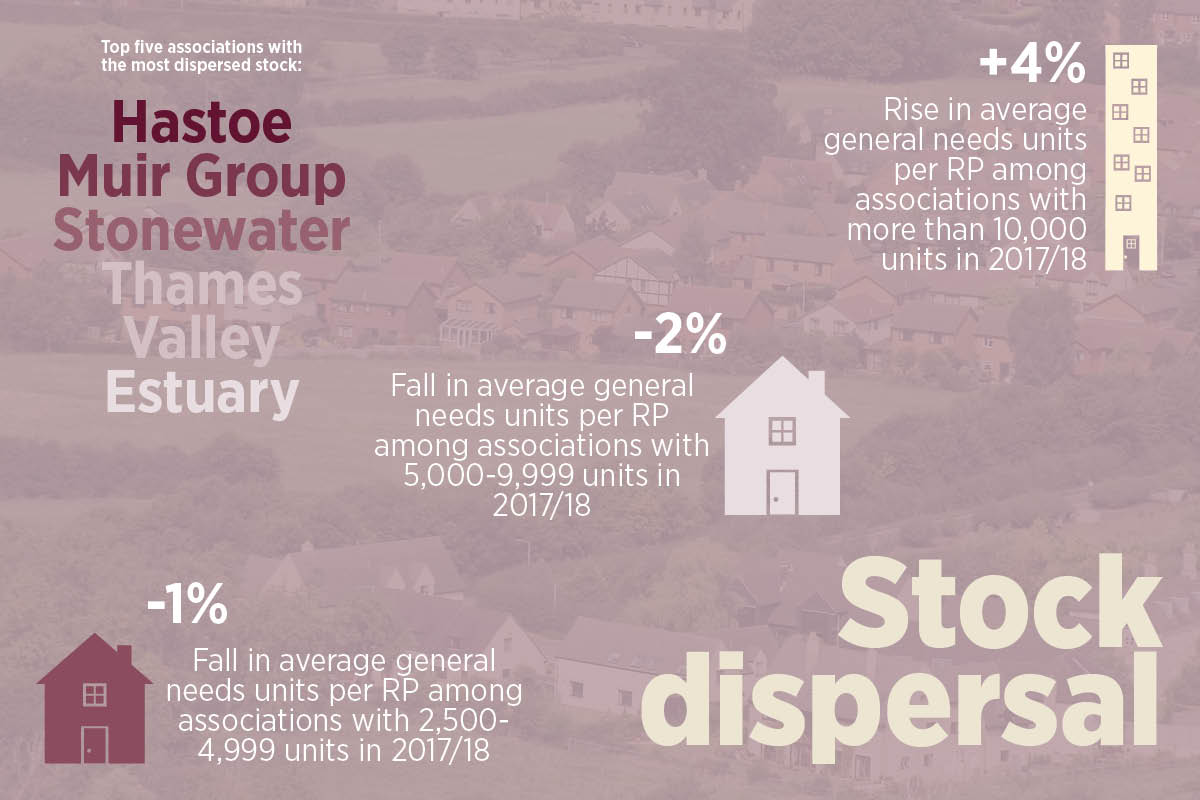
| 10,000+ | 65 | 22,510 | 39 | 571 |
| 5,000-9,999 | 55 | 6,952 | 10 | 686 |
| 2,500-4,999 | 45 | 3,678 | 8 | 464 |
| Total | 165 | 12,188 | 21 | 578 |
Notes: self-contained general needs units owned, excludes managed units owned by other RPs; **165 RPs (at group level) each owning more than 2,500 units of self-contained general needs stock (total two million units)

Social Housing has broken down the number of general needs units into three size band thresholds: 10,000+ general needs units; 5,000-9,999 general needs units; and 2,500-4,999 general needs units.
When looking at the average number of general needs units per local authority area,
the biggest change can be seen with RPs with between 5,000-9,999 general needs units. This size band saw a 10.3 per cent increase to 686 general needs units per local authority area, compared with 622 in 2015.
This stock concentration chimes with feedback from a number of experts and HAs operating within the sector, and Melissa Madjitey, associate director at Savills Housing Consultancy, says that registered providers (RPs) are consolidating their presence in local authority areas.
“For the RPs that we’re working with, they are making strategic decisions around their assets to concentrate their geographic footprint, both to maximise their operational efficiencies in terms of having a tighter area in which to operate but also in order to dispose of stock in outlying areas to support capacity for development growth.”
Ms Madjitey adds that overall there is now more of an active asset management approach among RPs, with stock rationalisation tending to sit alongside development and growth strategies.
“For most RPs, the focus is around delivering more social housing to the sector, so we find that stock rationalisation is very much about releasing capacity for growth.”
10,000+ general needs units
Analysis on the largest size band shows little change in the number of RPs within this group (2018: 65, 2015: 64) or their average number of local authority areas held (2018: 39, 2015: 38).
That said, a closer look at the individual RPs here has thrown up some noteworthy points.
For example, L&Q – which is the second-largest RP in the list with 59,988 general needs units – has steadily increased its average number of general needs units within its local authority areas at the same time as expanding its geographical footprint.
Speaking to Social Housing, Jack Fitzpatrick, research and strategy manager at the group, says there have been two drivers behind this growth. The first is L&Q’s merger with East Thames, which was announced in 2016. This played a part in “adding to L&Q’s existing geography” and increasing the group’s average general needs units per local authority area, says Mr Fitzpatrick.
He adds: “In terms of expanding out, that’s partially to East Thames but the general growth over the past few years is down to L&Q’s plans to expand out of London.”
Expansion areas include Essex, with the group’s Beaulieu Park development (which it is delivering with house builder Countryside) now well under way.
Mr Fitzpatrick explains how L&Q’s 2017 acquisition of strategic land company Gallagher Estates will also enable the group to expand into new areas within the Midlands.
“A key problem for all developers, not just RPs, is making sure we have a supply of land. So by acquiring Gallagher [Estates], we have that very large pipeline now into the future, which secures our ability to expand for quite a few years.”
He notes that in terms of future figures, this expansion drive is likely to bring down L&Q’s average general needs units per local authority area as its footprint continues to grow.
“L&Q has done stock rationalisation to rearrange its footprint but it’s not as common now because we are expanding. And we are not looking to cut down our areas – we’re looking to expand out where we can develop and manage stock.”
RPs’ presence in local authority areas (10,000+ general needs units)
| 10,000+ general needs units* | Number of local authorities | Number of general needs units* | Average number of general needs units per local authority* | |
|---|---|---|---|---|
| Number | % of general needs total | |||
| Bolton at Home | 1 | 14,949 | 14,949 | 100 |
| Plymouth Community Homes | 1 | 12,290 | 12,290 | 100 |
| Rochdale Boroughwide Housing | 1 | 11,976 | 11,976 | 100 |
| First Choice Homes Oldham | 1 | 11,484 | 11,484 | 100 |
| County Durham HG | 2 | 18,062 | 9,031 | 50 |
| Liverpool Mutual Homes | 2 | 14,561 | 7,281 | 50 |
| Gentoo Group | 4 | 28,523 | 7,131 | 25 |
| Wythenshawe Community HG | 2 | 13,288 | 6,644 | 50 |
| One Manchester | 2 | 11,614 | 5,807 | 50 |
| Wirral Partnership Homes | 2 | 11,038 | 5,519 | 50 |
| Incommunities Group | 4 | 20,494 | 5,124 | 25 |
| ForViva Group | 4 | 16,209 | 4,052 | 25 |
| Torus | 5 | 18,455 | 3,691 | 20 |
| Wakefield and District Housing | 8 | 29,110 | 3,639 | 12.5 |
| New Charter HT | 5 | 17,411 | 3,482 | 20 |
| Knowsley HT | 4 | 12,291 | 3,073 | 25 |
| Thirteen HG | 15 | 28,812 | 1,921 | 6.7 |
| One Vision Housing | 7 | 11,214 | 1,602 | 14.3 |
| Karbon Homes | 14 | 21,647 | 1,546 | 7.1 |
| Coast & Country Housing | 7 | 10,124 | 1,446 | 14.3 |
| Walsall HG | 14 | 19,578 | 1,398 | 7.1 |
| WM HG | 21 | 25,325 | 1,206 | 4.8 |
| Together HG | 28 | 33,019 | 1,179 | 3.6 |
| Vivid Housing | 19 | 22,228 | 1,170 | 5.3 |
| Peabody Trust 2018 | 39 | 40,742 | 1,045 | 2.6 |
| Wrekin HG | 10 | 10,287 | 1,029 | 10 |
| Fortis Living Group | 13 | 12,719 | 978 | 7.7 |
| Bernicia Group | 11 | 10,389 | 944 | 9.1 |
| Flagship HG | 22 | 18,909 | 860 | 4.5 |
| Onward Homes | 26 | 22,285 | 857 | 3.8 |
| Plus Dane Housing | 12 | 10,262 | 855 | 8.3 |
| Sovereign HA | 49 | 41,701 | 851 | 2 |
| Liverty | 33 | 27,605 | 837 | 3 |
| Yorkshire Housing | 18 | 14,767 | 820 | 5.6 |
| London & Quadrant HT | 78 | 59,988 | 769 | 1.3 |
| Midland Heart | 32 | 22,941 | 717 | 3.1 |
| Clarion HG | 159 | 90,687 | 570 | 0.6 |
| Notting Hill HT | 32 | 18,141 | 567 | 3.1 |
| Optivo | 53 | 29,681 | 560 | 1.9 |
| Aster Group | 41 | 22,194 | 541 | 2.4 |
| Radian Group | 30 | 15,730 | 524 | 3.3 |
| Hyde HA | 55 | 28,685 | 522 | 1.8 |
| Bromford HG | 47 | 23,065 | 491 | 2.1 |
| Your HG | 35 | 17,082 | 488 | 2.9 |
| Catalyst Housing | 29 | 12,936 | 446 | 3.4 |
| BPHA | 26 | 11,340 | 436 | 3.8 |
| Great Places HG | 31 | 13,102 | 423 | 3.2 |
| Waterloo Housing Group 2018 | 49 | 20,603 | 420 | 2 |
| Network Homes | 30 | 12,082 | 403 | 3.3 |
| Orbit Group | 74 | 29,756 | 402 | 1.4 |
| Longhurst Group | 42 | 16,568 | 394 | 2.4 |
| Paradigm HG | 28 | 10,777 | 385 | 3.6 |
| Riverside Group | 91 | 34,982 | 384 | 1.1 |
| Southern HG | 56 | 21,426 | 383 | 1.8 |
| Guinness Partnership | 137 | 46,529 | 340 | 0.7 |
| East Midlands HG | 33 | 10,852 | 329 | 3 |
| Home Group | 112 | 36,274 | 324 | 0.9 |
| Metropolitan HT | 70 | 22,573 | 322 | 1.4 |
| A2Dominion HG | 63 | 18,798 | 298 | 1.6 |
| Sanctuary HA | 192 | 51,483 | 268 | 0.5 |
| Genesis HA | 61 | 16,117 | 264 | 1.6 |
| Accent Group | 59 | 15,420 | 261 | 1.7 |
| Paragon Asra Housing | 70 | 16,213 | 232 | 1.4 |
| Places for People Group | 220 | 50,753 | 231 | 0.5 |
| Stonewater | 122 | 22,997 | 189 | 0.8 |
| Peer Group Average | 39 | 22,510 | 571 | 2.5 |
Note: *self-contained general needs units owned, excludes managed units owned by other RPs
Source: Regulator of Social Housing, Statistical Data Return 2017/18
Elsewhere, Clarion (which was formed out of the 2016 merger between Circle Housing and Affinity Sutton) was the largest RP within this group by far, with 90,687 general needs units.
These are spread across 159 local authority areas, with an average of 570 general needs units per local authority area, which represents 0.6 per cent of its total general needs stock.
Clarion has a comparatively high level of local authority areas that it operates within, compared with the other RPs on the list. It has set out plans to dispose of about one per cent of its stock each year, totalling roughly 10,000 homes over a decade.
It was topped only by Sanctuary, which operates in 192 local authority areas and has an average of 268 general needs units per local authority area, and Places for People (PfP), which operates in 220 local authority areas with 231 average general needs units.
Commenting on its disposal and growth programme in its most recent accounts, PfP said it would look to increase the profitability of its assets, through “targeted disposals and reinvestment in new assets”.
It added: “And where there is a good strategic fit, we will identify and pursue potential mergers and acquisitions to boost our asset base and geographic reach.”
When looking at the HAs with the highest and lowest averages of general needs stock per local authority area in this size band, Midlands provider Stonewater came last with 189 general needs units per local authority area, representing 0.8 per cent of its general needs total.
It was followed by PfP with 231 units, representing 0.5 per cent of its general needs total, and Paragon Asra Housing with 232 units, representing 1.4 per cent of its general needs stock.
5,000-9,999 general needs units
Moat has been the largest RP in the next size band down since 2015, with 9,764 general needs units.
Overall, the data shows that the organisation has been steadily decreasing its local authority areas, while increasing its average number of general needs units within those areas. Steve Nunn, the group’s executive director of development and new business, says this is the result of the group’s stock rationalisation strategy, which is “pretty much through”.
“We’ve had an active programme in outlying areas of our geography to generate a receipt to reinvest in our core areas,” he explains.
Looking at the most recent statistics for Moat, more than half of the group’s general needs units (4,902) are within seven local authority areas, the largest of which was Maldon with 1,348.
Five of its local authority areas have less than five general needs units, including Worthing with three units; Eastbourne with two units; and Adur, Enfield and Lewes, which each have one unit.
This was down on last year, when the HA had eight areas with less than five units, again demonstrating the organisation’s consolidation.
Mr Nunn says that, looking ahead, the group has developed a model to rank the performance of its assets as part of the group’s active asset management. “We rank all of our assets in terms of net present value (NPV) and then we determine which assets aren’t working as well for the business. So, if we’re spending more on that asset in terms of what we are receiving in rent, then there’s an issue that we need to delve into in a bit more detail.”
This may include assessing issues around geography, but it could also be to do with the building’s design or energy efficiency, he says.
“So, it could be that an asset works in NPV terms but they’re old properties or not thermally efficient, so we’d then have to think about what we do with that asset.
“In the extreme, that could mean we dispose of it or it could be that we look to inject some additional investment to do significant work to the asset or even change the tenure if that might make it work more effectively, but we do this in consultation with our core local authorities and, if necessary, with the regulator.”
RPs’ presence in local authority areas (5,000-9,999 general needs units)
| 5,000-9,999 general needs units* | Number of local authorities | Number of general needs units* | Average number of general needs units per local authority* | |
|---|---|---|---|---|
| Number | % of general needs total | |||
| Salix Homes | 1 | 7,809 | 7,809 | 100 |
| Halton Housing | 1 | 6,816 | 6,816 | 100 |
| Freebridge Community Housing | 1 | 6,179 | 6,179 | 100 |
| Trafford HT | 1 | 6,102 | 6,102 | 100 |
| Weaver Vale HT | 1 | 5,879 | 5,879 | 100 |
| Poplar Harca | 1 | 5,538 | 5,538 | 100 |
| Shoreline HP | 2 | 6,777 | 3,389 | 50 |
| Cobalt Housing | 2 | 5,972 | 2,986 | 50 |
| Southway HT (Manchester) | 2 | 5,776 | 2,888 | 50 |
| Livin Housing | 3 | 8,372 | 2,791 | 33.3 |
| Connexus Housing | 3 | 8,336 | 2,779 | 33.3 |
| Phoenix Community HA (Bellingham and Downham) | 2 | 5,326 | 2,663 | 50 |
| Ongo Homes | 4 | 9,758 | 2,440 | 25 |
| Vale of Aylesbury HT | 3 | 6,851 | 2,284 | 33.3 |
| Housing Plus Group | 5 | 9,700 | 1,940 | 20 |
| Greenfields Community HA | 4 | 7,556 | 1,889 | 25 |
| Aspire Housing | 5 | 7,971 | 1,594 | 20 |
| NSAH (Alliance Homes) | 4 | 6,071 | 1,518 | 25 |
| Silva Homes | 4 | 5,700 | 1,425 | 25 |
| Trent & Dove Housing | 4 | 5,594 | 1,399 | 25 |
| Curo Group (Albion) | 8 | 9,374 | 1,172 | 12.5 |
| Community Gateway Association | 5 | 5,730 | 1,146 | 20 |
| Merlin Housing Society | 6 | 6,557 | 1,093 | 16.7 |
| North Hertfordshire Homes | 7 | 7,387 | 1,055 | 14.3 |
| Yarlington HG | 8 | 7,688 | 961 | 12.5 |
| Cross Keys Homes | 11 | 8,965 | 815 | 9.1 |
| Futures HG | 8 | 5,782 | 723 | 12.5 |
| Golding Homes | 8 | 5,715 | 714 | 12.5 |
| GreenSquare Group | 13 | 9,146 | 704 | 7.7 |
| Irwell Valley HA | 9 | 6,234 | 693 | 11.1 |
| Magna Housing | 9 | 6,079 | 675 | 11.1 |
| Chelmer HP | 13 | 8,351 | 642 | 7.7 |
| Soha Housing | 8 | 5,113 | 639 | 12.5 |
| Wandle HA | 9 | 5,747 | 639 | 11.1 |
| Raven HT | 8 | 5,067 | 633 | 12.5 |
| Saffron HT | 8 | 5,058 | 632 | 12.5 |
| West Kent HA | 9 | 5,392 | 599 | 11.1 |
| Havebury HP | 10 | 5,891 | 589 | 10 |
| Grand Union HG | 14 | 8,094 | 578 | 7.1 |
| Accord HA | 15 | 8,663 | 578 | 6.7 |
| Richmond HP | 12 | 6,818 | 568 | 8.3 |
| Broadacres HA | 11 | 5,703 | 518 | 9.1 |
| Town & Country HG | 15 | 7,608 | 507 | 6.7 |
| Jigsaw Homes Group | 19 | 9,293 | 489 | 5.3 |
| Regenda | 22 | 9,641 | 438 | 4.5 |
| Swan HA | 17 | 6,957 | 409 | 5.9 |
| Acis Group | 13 | 5,169 | 398 | 7.7 |
| Mosscare St Vincent's HG | 17 | 6,666 | 392 | 5.9 |
| Castles & Coasts HA | 15 | 5,272 | 351 | 6.7 |
| Aldwyck HG | 20 | 6,953 | 348 | 5 |
| Rooftop HG | 17 | 5,041 | 297 | 5.9 |
| One Housing Group | 31 | 8,770 | 283 | 3.2 |
| Nottingham Community HA | 27 | 6,764 | 251 | 3.7 |
| Moat Homes | 41 | 9,764 | 238 | 2.4 |
| Thames Valley HA | 41 | 7,799 | 190 | 2.4 |
| Peer group average | 10 | 6,952 | 686 | 9.9 |
Note: *self-contained general needs units owned, excludes managed units owned by other RPs
Source: Regulator of Social Housing, Statistical Data Return 2017/18
Elsewhere in the disposals market, the sector has a growth in interest from new entrants eyeing stock.
As Savills’ Ms Madjitey notes: “We’re seeing more bids from new entrants that are keen to enter the market, who have different business models. Some are keen to grow via new build or buying Section 106, although some of them are looking at existing stock.”
This change has brought with it a number of challenges for traditional HAs. Moat, for example, made the headlines in November after receiving a governance downgrade from G1 to G2, following the sale of 26 homes for older people to a for-profit provider of social housing.
The regulator said the decision to sell the homes had been made “solely on financial criteria”. A Moat spokesperson at the time said: “Moat still retains the highest financial rating of V1 and we are already having positive discussions with the regulator about what we need to do in order to return to a G1 governance rating.”
The judgement came at a time when the regulator was scrutinising for-profit providers and equity-based and lease-based deals more closely. A number have been downgraded over financial viability issues or for poor governance that affected tenants.
On working with non-traditional RPs in the future, Mr Nunn says the experience will shape the group’s future disposal decisions. “When you are looking at non-traditional housing association stock disposal, there needs to be a heightened level of due diligence that you need to take. You need to satisfy yourselves that that stock is going to someone who is going to manage it effectively and they’re financially stable enough to be able to do that,” he says.
More generally, he adds: “[HAs] need to be mindful of who they are disposing the stock to. It can’t always be through a financial lens; you’ve got to think about who the recipient is and how they are going to manage those properties if they’re going to be custodians of those properties in the long term and how you’re going to ensure there’s no leakage of social assets and social value out of the sector.”
On this, Savills’ Ms Madjitey says it is important that boards have oversight and “own the decision” to sell to new entrants, which chimes with Mr Nunn’s comments – he adds that the experience fed into the group’s asset model, too.
Looking at the list, the top five HAs with the highest average of general needs units per local authority area were: Salix Homes (7,809), Halton Housing (6,816), Freebridge Community Housing (6,179), Trafford Housing Trust (6,102) and Weaver Vale Housing Trust (5,879). All five operated within one local authority area only.
In contrast, Thames Valley Housing (TVH) – which is now part of Metropolitan Thames Valley following a merger with Metropolitan – had the lowest average per local authority area with 190 general needs units. However, this had increased on last year when the group had an average of 187 general needs units, which suggests that TVH is consolidating its presence.

2,500-4,999 general needs units
There has been some interesting activity within the smallest general needs size band of between 2,500-4,999 units, with the overall number of RPs in this list declining to 45 this year, from 61 in 2015.
Victory Housing Trust is now the largest RP in this group, with 4,970 general needs units. This is partly because many of the RPs that sat at the top of this list over the past four years – such as NSAH (Alliance Homes), Soha, Rooftop and Saffron – have all moved up into the larger size bracket of between 5,000 and 9,999 general needs units. But it is also because Victory has seen a
sizeable 12 per cent increase in its total number of general needs units on last year, when it had 4,432. This correlates with the group’s development plans, which include a goal to have 1,600 more homes by March 2022.
Victory is also on track for further expansion, with plans to merge with Flagship Housing Group (which sits in the largest general needs unit size band in this report).
The group announced the merger on 2 January. Victory will join Flagship as a subsidiary. The new organisation plans to build 10,000 homes and save more than £38m in its first decade. It also plans to spend £524m on maintaining and improving its existing stock. Victory’s merger is emblematic of what is taking place in the market today, particularly among smaller RPs.
RPs’ presence in local authority areas (2,500-4,999 general needs units)
| 2,500-4,999 general needs units* | Number of local authorities | Number of general needs units* | Average number of general needs units per local authority* | |
|---|---|---|---|---|
| Number | % of general needs total | |||
| Stafford and Rural Homes | 1 | 4,738 | 4,738 | 100.0 |
| Yorkshire Coast Homes | 1 | 4,217 | 4,217 | 100.0 |
| Red Kite Community Housing | 1 | 4,036 | 4,036 | 100.0 |
| South Liverpool Homes | 1 | 3,619 | 3,619 | 100.0 |
| Coastline Housing | 1 | 3,465 | 3,465 | 100.0 |
| Ocean HG | 1 | 3,334 | 3,334 | 100.0 |
| South Lakes Housing | 1 | 2,658 | 2,658 | 100.0 |
| Teign Housing | 1 | 2,550 | 2,550 | 100.0 |
| Watford Community HT | 2 | 4,087 | 2,044 | 50.0 |
| The Community HG | 2 | 3,566 | 1,783 | 50.0 |
| Bournville Village Trust | 2 | 3,269 | 1,635 | 50.0 |
| Selwood Housing Society | 3 | 4,626 | 1,542 | 33.3 |
| Wellingborough Homes | 3 | 4,305 | 1,435 | 33.3 |
| North Devon Homes | 2 | 2,674 | 1,337 | 50.0 |
| Gloucester City Homes | 3 | 3,894 | 1,298 | 33.3 |
| Cheshire Peaks & Plains HT | 3 | 3,830 | 1,277 | 33.3 |
| Watmos Community Homes | 2 | 2,550 | 1,275 | 50.0 |
| B3 Living | 4 | 3,410 | 853 | 25.0 |
| Calico Homes | 4 | 3,400 | 850 | 25.0 |
| Leeds Federated HA | 4 | 3,290 | 823 | 25.0 |
| Boston Mayflower | 5 | 3,674 | 735 | 20.0 |
| Victory HT | 7 | 4,970 | 710 | 14.3 |
| Two Rivers Housing | 5 | 3,258 | 652 | 20.0 |
| Bromsgrove District HT | 4 | 2,595 | 649 | 25.0 |
| Worthing Homes | 5 | 3,072 | 614 | 20.0 |
| Newlon HT | 9 | 4,797 | 533 | 11.1 |
| Hexagon HA | 7 | 3,538 | 505 | 14.3 |
| Cottsway HA | 9 | 4,390 | 488 | 11.1 |
| Severn Vale Housing Society | 6 | 2,880 | 480 | 16.7 |
| Saxon Weald Homes | 9 | 4,120 | 458 | 11.1 |
| Progress HG | 11 | 4,716 | 429 | 9.1 |
| Housing Solutions | 9 | 3,803 | 423 | 11.1 |
| Octavia Housing | 9 | 3,716 | 413 | 11.1 |
| Westward HG | 12 | 4,949 | 412 | 8.3 |
| Shepherds Bush HA | 9 | 3,367 | 374 | 11.1 |
| Broadland HA | 11 | 4,061 | 369 | 9.1 |
| Thrive Homes | 11 | 3,493 | 318 | 9.1 |
| South Yorkshire HA | 12 | 3,795 | 316 | 8.3 |
| North Star HG | 10 | 2,956 | 296 | 10.0 |
| Origin Housing | 14 | 3,984 | 285 | 7.1 |
| Orwell HA | 11 | 2,684 | 244 | 9.1 |
| Hightown HA | 17 | 3,779 | 222 | 5.9 |
| Estuary HA | 16 | 3,377 | 211 | 6.3 |
| Muir Group HA | 27 | 3,903 | 145 | 3.7 |
| Hastoe HA | 70 | 4,105 | 59 | 1.4 |
| Peer group average | 8 | 3,678 | 464 | 12.6 |
Note: *self-contained general needs units owned, excludes managed units owned by other RPs
Source: Regulator of Social Housing, Statistical Data Return 2017/18
According to Aruna Sarwar, solicitor at Devonshires, whose clients include a number of small RPs in London, smaller organisations are increasingly looking at ways to become more attractive for potential mergers.
She says: “For the smaller organisations, it’s really a fight for survival because larger RPs are becoming extremely large and it’s either join up or be taken over. Mergers in the sector such as Notting Hill Genesis or [Peabody and] Family Mosaic basically mean that all of their departments are looking at their stock and looking to dispose of things that don’t fit in with the general scope of the direction the new RP is going in – and I’m seeing this a lot with the smaller RPs, which are fighting for their market share.”
She adds: “They are not just acquiring stock but are looking to dispose of it because they want to make themselves more streamlined and attractive to potential mergers. They want to make sure they’ve got the right assets, so getting rid of the stock that isn’t performing as well or perhaps falls outside an area where the larger RP is looking to grow could make themselves more of an attractive proposition.”
Elsewhere in this list, the HA with the largest local authority count was Hastoe, with 70. Its average number of general needs units per local authority area was 59, which represents 1.4 per cent of its total stock.
In contrast, Victory had an average of 710 units per local authority area, which represented 14.3 per cent of its total stock.
Clarion: geographical spread
| Local authority name | Number of general needs units |
|---|---|
| Bromley | 10,289 |
| Tonbridge and Malling | 6,247 |
| Merton | 5,935 |
| Tower Hamlets | 3,957 |
| Mid Sussex | 3,922 |
| Hertsmere | 3,835 |
| Fenland | 3,594 |
| Broadland | 3,307 |
| Mole Valley | 3,010 |
| East Hertfordshire | 2,533 |
| Islington | 2,516 |
| Waltham Forest | 1,556 |
| Birmingham | 1,505 |
| Plymouth | 1,438 |
| Haringey | 1,422 |
| Hackney | 1,272 |
| Brighton & Hove | 1,229 |
| Camden | 987 |
| Southwark | 968 |
| Basingstoke and Deane | 879 |
| Chichester | 872 |
| Kensington and Chelsea | 870 |
| Luton | 801 |
| Lewisham | 757 |
| South Tyneside | 752 |
| Dacorum | 723 |
| Basildon | 710 |
| Stoke-on-Trent | 682 |
| Chelmsford | 629 |
| Barking & Dagenham | 624 |
| Bradford | 621 |
| Kingston upon Hull; City of | 609 |
| Middlesbrough | 598 |
| Plus 20,572 homes in 93 local authorities | |
| Shropshire | 28 |
| Gosport | 24 |
| Solihull | 24 |
| South Somerset | 24 |
| Thanet | 24 |
| Winchester | 22 |
| Colchester | 21 |
| Kettering | 21 |
| Mid Devon | 20 |
| Shepway | 18 |
| Wycombe | 17 |
| Eastleigh | 16 |
| Three Rivers | 16 |
| Wiltshire | 16 |
| Harrow | 15 |
| Christchurch | 14 |
| Daventry | 14 |
| Hart | 13 |
| Suffolk Coastal | 13 |
| Bexley | 12 |
| Wandsworth | 12 |
| Lichfield | 11 |
| Dartford | 10 |
| Epsom and Ewell | 9 |
| Hastings | 9 |
| South Kesteven | 9 |
| Epping Forest | 8 |
| St Albans | 8 |
| Woking | 7 |
| Wolverhampton | 4 |
| Wellingborough | 3 |
| West Oxfordshire | 3 |
| Bromsgrove | 1 |
Moat: geographical spread
| Local authority name | Number of general needs units |
|---|---|
| Maldon | 1,348 |
| Merton | 912 |
| Swale | 712 |
| Medway | 672 |
| Greenwich | 443 |
| Sevenoaks | 421 |
| Ashford | 394 |
| Dartford | 393 |
| Gravesham | 359 |
| Crawley | 341 |
| Mid Sussex | 299 |
| Croydon | 287 |
| Harlow | 251 |
| Thurrock | 249 |
| Tonbridge and Malling | 246 |
| Tunbridge Wells | 235 |
| Sutton | 233 |
| Basildon | 231 |
| Bromley | 218 |
| Brighton & Hove | 200 |
| Uttlesford | 176 |
| Horsham | 169 |
| Bexley | 142 |
| Wealden | 130 |
| Chelmsford | 128 |
| Canterbury | 113 |
| Epping Forest | 80 |
| Shepway | 71 |
| Southend-on-Sea | 64 |
| Maidstone | 63 |
| Dover | 58 |
| Castle Point | 50 |
| Rochford | 39 |
| Lewisham | 11 |
| Brentwood | 10 |
| Thanet | 8 |
| Worthing | 3 |
| Eastbourne | 2 |
| Adur | 1 |
| Enfield | 1 |
| Lewes | 1 |
Victory: geographical spread
| Local authority name | Number of general needs units |
|---|---|
| North Norfolk | 4,655 |
| Broadland | 196 |
| King's Lynn & West Norfolk | 49 |
| South Norfolk | 49 |
| Breckland | 8 |
| Norwich | 7 |
| Great Yarmouth | 6 |
RELATED

News10 Mar 2025
Community Housing hires interim chief financial officer

News05 Mar 2025
Two Essex landlords in talks to merge by end of year
 funding boost")

News04 Mar 2025
North Yorkshire landlord raises £75m under guarantee scheme
- © Social Housing
- All rights reserved