Slowdown in shared ownership sales driven by London slump
England, excluding London, has seen a four per cent rise in shared ownership sales – much lower than last year’s 16 per cent increase, exclusive analysis by Social Housing has found.
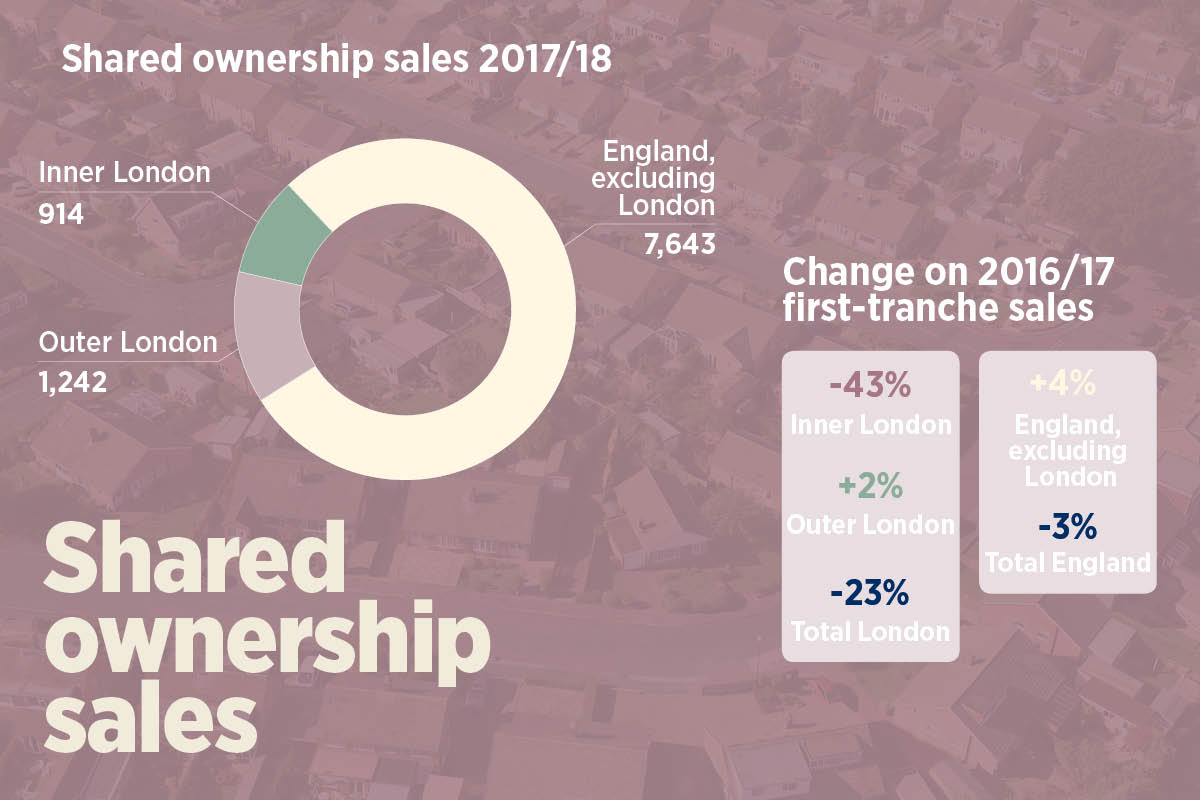
The shared ownership market saw a slowdown during 2017/18, driven by a significant drop in sales in the capital.
Inner London sold just 914 first-tranche shared ownership units for the period, compared with 1,596 the year before, which represented a sizeable 43 per cent decrease.
Social Housing’s analysis used data from the Regulator of Social Housing’s Statistical Data Return for 2018.
“Where there are affordability challenges, without extremely high prices, this is where shared ownership will do well”
England, excluding London, saw a four per cent rise in sales – considerably down on last year’s 16 per cent sales increase. This decline caused the overall number of sales for England to dip back under the 10,000 unit mark it had reached the prior year, with a total of 9,799 sales for 2017/18. That said, outer London saw a two per cent increase in sales – a large jump on the year before when sales were down 27 per cent.
On this, Melanie Rees, head of policy and external affairs at the Chartered Institute of Housing (CIH), says that while the market was generally doing well, higher-value shared ownership products in city centres, including London, were more vulnerable.
She adds: “With outright homeownership becoming out of the reach of so many people and it being hard for people to get a decent place to rent, more people are looking at shared ownership now. This explains why the statistics show the rest of England doing OK.
“Price could be the issue for inner London, though. Wages aren’t keeping up, while prices are going up, so even shared ownership is beyond the reach for a lot of people there now.”
Elsewhere, the number of low-cost homeownership (LCHO) units that have not yet been fully staircased returned to growth with 181,057 units, up from 175,265 in 2016/17, after dropping by 0.4 per cent at the time of Social Housing’s previous report.
This year’s increase was driven by England, excluding London, which saw a rise to 132,832 units from 127,945. Inner London saw a marginal decrease of 0.1 per cent to 21,878 units, while outer London saw an increase of nearly four per cent to 26,347 units.
Read more


A report by Aster Housing looking at shared ownership (which sits in the top 10 list for LCHO sales), said that affordability and a lack of awareness are holding customers back from growing their equity stakes.
It found that 63 per cent of respondents who hadn’t yet staircased cited affordability issues, while more than half were unaware they were able to move between shared ownership properties. Only 14 per cent, meanwhile, had received information about the tenure from the government, which the report said was holding the sector back.
Since then, the government has scrapped stamp duty for first-time buyers of shared ownership homes, which the CIH’s Ms Rees agrees could “play a part” in improving the visibility of the product, but she flags other affordability barriers holding back the market, including legal costs.
She adds: “The other thing with shared ownership, as much as it’s a good option for people, is that they may only buy a 50 per cent share but still have a 100 per cent responsibility for the maintenance and upkeep, which is another issue around affordability.”
LA and RP overall sales: top 30 list
There were two new entrants in the top 10 RPs with the largest sales. They were Home Group (in the North) and Vivid (in Hampshire), replacing Notting Hill (in London) and Waterloo (in the Midlands). Only three registered providers (RPs) in the top 30 sales list sold less than 100 units. They were Riverside (99 units), Peabody (95 units) and Raven Housing Trust (93 units).
Orbit was the RP with the most overall sales, at 693 units. John Carleton, its executive director of property investment, says that over the past year Orbit has had a larger number of properties available across a range of tenures, which has had a positive impact on shared ownership sales.
“Erith Park in Bexley and Union Park in Leamington Spa continue to do well and we have ensured that customers can access our sites more readily, either in person or online,” he says. “This, combined with a good market and mortgage availability, has supported the increased number of shared ownership sales reported here.”

Mr Carleton’s comments also help to explain the rise in first-tranche sales in the Bexley local authority area, which not only had the largest sales increase with a 161 per cent jump, but was also the fifth local authority area with the most first-tranche sales, with 154 units. Cornwall was the local authority with the most sales, with 233 units.
Although on this, Helen Collins, head of the housing consultancy team at Savills, says that while the South West has been a “very good market generally”, the figures could be reflective of where supply has been delivered rather than a bigger picture of market demand characteristics.
“Generally, where there are affordability challenges, but without extremely high prices, this is where shared ownership will do well,” she adds. “It can struggle in lower-value markets where someone on a lower income of £30,000 may well be able to buy a second-hand property with a conventional mortgage.”
RP shared ownership sales 2017/18: top 30
| First tranche sales 2017/18 | |||||
|---|---|---|---|---|---|
| Change on 16/17 sales | |||||
| Registered provider | LCHO less than 100 per cent equity number of units | First-tranche number | Percentage | Number | Sales effort percentage of stock* |
Orbit | 9,281 | 693 | +82% | +312 | 7% |
| Clarion | 7,569 | 410 | +45% | +127 | 5% |
| L&Q | 8,671 | 408 | -58% | -560 | 5% |
| Hyde | 4,271 | 378 | +26% | +79 | 9% |
| Metropolitan | 4,120 | 311 | +15% | +41 | 8% |
| Sovereign | 5,669 | 310 | -28% | -120 | 5% |
| Home Group | 2,101 | 264 | +41% | +77 | 13% |
| Moat | 4,989 | 232 | +9% | +19 | 5% |
| Aster | 2,414 | 230 | +1% | +2 | 10% |
| Vivid | 2,713 | 229 | n/a | n/a | 8% |
| Liverty | 3,703 | 224 | n/a | n/a | 6% |
| Bromford | 2,848 | 216 | +31% | +51 | 8% |
| Waterloo | 3,529 | 212 | -17% | -44 | 6% |
| Stonewater | 2,341 | 211 | +33% | +52 | 9% |
| One Housing | 1,705 | 195 | n/a | +195 | 11% |
| Thames Valley | 7,586 | 194 | +40% | +55 | 3% |
| Longhurst | 1,652 | 167 | +42% | +49 | 10% |
| Notting Hill Housing | 5,238 | 162 | -59% | -236 | 3% |
| Radian | 2,290 | 158 | +58% | +58 | 7% |
| Optivo | 3,605 | 157 | n/a | n/a | 4% |
| Cross Keys Homes | 656 | 153 | +34% | +39 | 23% |
| BPHA | 2,206 | 148 | -12% | -21 | 7% |
| Fortis Living | 1,063 | 132 | +31% | +31 | 12% |
| Paradigm | 2,023 | 131 | -29% | -54 | 6% |
| Catalyst | 3,448 | 128 | +146% | +76 | 4% |
| PA Housing | 1,346 | 120 | n/a | n/a | 9% |
| Great Places | 1,256 | 106 | -45% | -87 | 8% |
| Riverside | 1,713 | 99 | +125% | +55 | 6% |
| Peabody | 4,237 | 95 | n/a | n/a | 2% |
| Raven Housing Trust | 315 | 93 | +41% | +27 | 30% |
| Notes: * ‘Sales effort’ = number of sales in 17/18 as a percentage of total LCHO stock in 17/18 Source: Regulator of Social Housing, Statistical Data Return 2017/18 | |||||
Of the top 30 local authority areas in terms of sales, 10 sold less than 100 units. Enfield sat at the bottom of the list with 82 sales, which was down 18 per cent on last year.
G15 sales chimed with the overall dampening of the London market, dropping from 3,045 to 2,496. The number of RPs outside the G15 that sold more than 150 units increased slightly to 14 from 13, with a total of 3,493 sales, compared with 2,898 the year before.
The biggest change in terms of size bands, however, could be seen within the RPs that sold between 100 and 150 units. This number halved to five RPs, which caused sales to drop here from 1,194 units to 637 units.
There was a rise in the number of RPs selling between 25 and 49 units to 34 RPs. They sold a total of 1,199 units compared with last year when 27 RPs sold 965 units.
Summary of LCHO and shared ownership sales: England 2017/18
| First-tranche sales 2017/19 | |||||
|---|---|---|---|---|---|
| Change on 16/17 sales | |||||
| Local authority | LCHO less than 100 per cent equity number of units | Number | Percentage | Number | Sales effort percentage of stock |
| Inner London | 21,878 | 914 | -43% | -682 | 4% |
| Outer London | 26,347 | 1,242 | +2% | +28 | 5% |
| Total London | 48,225 | 2,156 | -23% | -654 | 4% |
| England exc. London | 132,832 | 7,643 | +4% | +310 | 6% |
| Total England | 181,057 | 9,799 | -3% | -344 | 5% |
| Note: aggregated data for RPs larger than 1,000 units | |||||
LA and RP increase and decrease
L&Q saw a significant 58 per cent decrease in first-tranche sales for 2017/18 to 408 units – a drop of 560 units, the largest decrease in sales.
However, the group told Social Housing that it had made an error in compiling data from two systems following its recent merger with East Thames.
An L&Q spokesperson says: “Essentially, we’ve sold around 1,300 shared ownership units over two years. We believe our financial statements offer a more accurate timeline of when those sales occurred – 619 in 2016/17 and 679 in 2017/18 – for a total of 1,298.”
Notting Hill Housing followed L&Q, with a decrease of 236 units, representing a 59 per cent drop for the organisation.
A spokesperson for the group says: “The sales of first-tranche shared ownership homes in 2017/18 were proportionate to former Notting Hill Housing’s sales programme. In the previous year we had seen a larger number of homes for sale handed over (and therefore a larger sales programme), including a number of schemes that completed at the turn of that financial year, which led to a spike in sales.”
In contrast, Orbit had the largest number of first-tranche sales increase for 2017/18, representing an 82 per cent jump on the year before, with a rise of 312 units.
London-based RPs One Housing (a rise of 195 units), Clarion (127 units) and Hyde (79 units),
as well as Home Group (77 units) in the North, made up the remaining top five providers with the largest sales increases.
RP shared ownership sales 2017/18: top 25 increased sales
| First-tranche sales 2017/18 | |||||
|---|---|---|---|---|---|
| Change on 16/17 sales | |||||
| Registered provider | LCHO less than 100 per cent equity number of units | First-tranche number | Percentage | Number | Sales effort percentage of stock* |
| Orbit | 9,281 | 693 | +82% | +312 | 7% |
| One Housing | 1,705 | 195 | n/a | +195 | 11% |
| Clarion | 7,569 | 410 | +45% | +127 | 5% |
| Hyde | 4,271 | 378 | +26% | +79 | 9% |
| Home Group | 2,101 | 264 | +41% | +77 | 13% |
| Catalyst | 3,448 | 128 | +146% | +76 | 4% |
| Chelmer Housing Partnership | 434 | 70 | n/a | +70 | 16% |
| Radian | 2,290 | 158 | +58% | +58 | 7% |
| Wandle | 697 | 89 | +178% | +57 | 13% |
| Thames Valley | 7,586 | 194 | +40% | +55 | 3% |
| Riverside | 1,713 | 99 | +125% | +55 | 6% |
| Stonewater | 2,341 | 211 | +33% | +52 | 9% |
| Bromford | 2,848 | 216 | +31% | +51 | 8% |
| Longhurst | 1,652 | 167 | +42% | +49 | 10% |
| Coastline | 263 | 77 | +141% | +45 | 29% |
| Walsall Housing Group | 146 | 68 | +172% | +43 | 47% |
| Metropolitan | 4,120 | 311 | +15% | +41 | 8% |
| Cross Keys Homes | 656 | 153 | +34% | +39 | 23% |
| Liverpool Mutual Homes | 115 | 39 | +1,850% | +37 | 34% |
| Selwood Housing Society | 115 | 47 | +292% | +35 | 41% |
| Aspire | 210 | 58 | +142% | +34 | 28% |
| Fortis Living | 1,063 | 132 | +31% | +31 | 12% |
| Greenfields Community HA | 123 | 46 | +188% | +30 | 37% |
| Raven Housing Trust | 315 | 93 | +41% | +27 | 30% |
| Wythenshawe Community | 137 | 37 | +270% | +27 | 27% |
| Notes: * ‘Sales effort’ = number of sales in 17/18 as a percentage of total LCHO stock in 17/18. N/a = 2017 figure was 0 Source: Regulator of Social Housing (RSH), Statistical Data Return 2017/18 | |||||
Tower Hamlets – which for the previous two years had been the local authority area with the largest sales increase – had the biggest sales decline during 2017/18, with a drop of 71 per cent (or 275 units). RPs in the borough sold 114 units.
Eleven other local authority areas that had previously been in the top 25 increase list also found themselves to be the areas with the largest sales decline. The majority – eight – of these 11 local authority areas were in London and the South, including Barnet, Stevenage, Waltham Forest and Bristol.
Savills’ Ms Collins says this could be down to development cycles and availability: “You might get a spike of schemes or one big scheme one year and then that washes through the stats. Then there’s nothing the following year but then it comes back the year after that. So I don’t think that’s reflective of the market, I think that’s supply.”
RP shared ownership sales 2017/18: top 25 decreased sales
| First-tranche sales 2017/18 | |||||
|---|---|---|---|---|---|
| Change on 16/17 sales | |||||
| Registered provider | LCHO less than 100 per cent equity number of units | First-tranche number | Percentage | Number | Sales effort percentage of stock* |
| L&Q | 8,671 | 408 | -58% | -560 | 5% |
| Notting Hill Housing | 5,238 | 162 | -59% | -236 | 3% |
| Network Homes | 1,811 | 38 | -77% | -126 | 2% |
| Sovereign | 5,669 | 310 | -28% | -120 | 5% |
| Great Places | 1,256 | 106 | -45% | -87 | 8% |
| Sanctuary | 3,917 | 62 | -58% | -85 | 2% |
| Jigsaw (Adactus) | 386 | 16 | -81% | -68 | 4% |
| The Guinness Partnership | 6,339 | 38 | -63% | -66 | 1% |
| Town & Country Housing | 619 | 15 | -81% | -65 | 2% |
| Aldwyck Housing Group | 1,082 | 29 | -66% | -57 | 3% |
| Paradigm Housing | 2,023 | 131 | -29% | -54 | 6% |
| Housing & Care 21 | 367 | 8 | -87% | -52 | 2% |
| Waterloo Housing | 3,529 | 212 | -17% | -44 | 6% |
| Torus | 421 | 4 | -91% | -43 | 1% |
| A2Dominion | 3,190 | 58 | -40% | -38 | 2% |
| Yarlington | 701 | 34 | -52% | -37 | 5% |
| Thirteen | 762 | 32 | -52% | -34 | 4% |
| Genesis | 4,091 | 69 | -30% | -29 | 2% |
| Thrive Homes | 98 | 9 | -76% | -29 | 9% |
| One Vision | 142 | 43 | -39% | -28 | 30% |
| Places for People | 4,212 | 53 | -34% | -27 | 1% |
| The Wrekin Housing Group | 198 | 0 | -100% | -26 | 0% |
| EMH Group | 1,502 | 54 | -32% | -25 | 4% |
| Southern | 2,932 | 87 | -22% | -25 | 3% |
| Housing Solutions | 389 | 41 | -37% | -24 | 11% |
| Notes: * ‘Sales effort’ = number of sales in 17/18 as a percentage of total LCHO stock in 17/18. N/a = 2017 figure was 0 Source: RSH, Statistical Data Return 2017/18 | |||||
Southwark was the only local authority area within the top 25 decrease list where more than 200 units were sold. Despite this, it recorded a 21 per cent drop in sales. Elsewhere, the local authority areas with the largest sales increases were Bexley (increase of 95 units), Sutton (84), Maidstone (74), Ealing (72) and Welwyn Hatfield (68), which are in all in the South of England.
Of those, the local authority area with the highest number of LCHO units that had not yet been fully staircased was Ealing, with 2,120. This was the second-highest number in the top 25 sales increase list, topped by Cornwall which had 2,166 LCHO units that had not yet been fully staircased.
Lichfield had the smallest number of LCHO units that had not yet been fully staircased, with 273 in total. It recorded 35 sales this year.
Shared ownership sales in local authority areas 2017/18: top 30
| First tranche sales 2017/18 | |||||
|---|---|---|---|---|---|
| Change on 16/17 sales | |||||
| Registered provider | LCHO less than 100 per cent equity number of units | Number | Percentage | Number | Sales effort percentage of stock* |
| Cornwall | 2,166 | 233 | +25% | +47 | 11% |
| Southwark | 2,991 | 215 | -21% | -56 | 7% |
| Greenwich | 2,498 | 179 | -13% | -27 | 7% |
| Newham | 2,574 | 170 | +16% | +23 | 7% |
| Bexley | 1,466 | 154 | +161% | +95 | 11% |
| Wokingham | 1,014 | 148 | +59% | +55 | 15% |
| Wiltshire | 1,615 | 141 | +41% | +41 | 9% |
| Wandsworth | 2,377 | 135 | -53% | -151 | 6% |
| Milton Keynes | 5,389 | 125 | -19% | -29 | 2% |
| Dartford | 821 | 121 | +17% | +18 | 15% |
| Cherwell | 675 | 120 | +50% | +40 | 18% |
| Cambridge | 566 | 119 | +38% | +33 | 21% |
| Maidstone | 879 | 116 | +176% | +74 | 13% |
| Tower Hamlets | 3,025 | 114 | -71% | -275 | 4% |
| Ealing | 2,120 | 109 | +195% | +72 | 5% |
| Cheshire West and Chester | 1,453 | 108 | -9% | -11 | 7% |
| Stratford-on-Avon | 1,065 | 106 | +68% | +43 | 10% |
| Warwick | 960 | 103 | +134% | +59 | 11% |
| Sutton | 759 | 102 | +467% | +84 | 13% |
| Kettering | 685 | 101 | +181% | +65 | 15% |
| Cheshire East | 891 | 98 | +51% | +33 | 11% |
| Lewisham | 1,849 | 96 | -11% | -12 | 5% |
| Wakefield | 609 | 95 | +9% | +8 | 16% |
| Barnet | 1,418 | 94 | -44% | -74 | 7% |
| Bedford | 1,165 | 91 | -13% | -14 | 8% |
| South Gloucestershire | 639 | 86 | +32% | +21 | 13% |
| West Berkshire | 678 | 86 | +51% | +29 | 13% |
| Hounslow | 2,049 | 85 | +57% | +31 | 4% |
| Horsham | 661 | 84 | +53% | +29 | 13% |
| Enfield | 1,261 | 82 | -18% | -18 | 7% |
| Notes: * ‘Sales effort’ = number of sales in 17/18 as a percentage of total LCHO stock in 17/18 Source: Regulator of Social Housing, Statistical Data Return 2017/18 | |||||
Risk
The regulator’s 2018 Sector Risk Profile said that first-tranche shared ownership sales remain a “significant source of income” for RPs, with sales income expected to increase from £1.2bn per year to more than £2bn by 2020.
But it cautioned that providers should have other options available if sales and staircasing are not delivered in line with their plans. This was because during the last major housing market crash in 2008/09, providers saw a major reduction in values and long delays in sales to shared ownership properties, which required “significant” financial support from the government in order to convert the properties to rent.
“Boards of registered providers must ensure that the information they receive on sales risk exposure is sufficiently robust to support the effectiveness of their decision-making processes,” the regulator added.
Shared ownership sales by RPs in local authority areas 2017/18: top 25 increased sales
| First-tranche sales 2017/18 | |||||
|---|---|---|---|---|---|
| Change on 16/17 sales | |||||
| Local authority | LCHO less than 100 per cent equity number of units | Number | Percentage | Number | Sales effort percentage of stock* |
| Bexley | 1,466 | 154 | +161% | +95 | 11% |
| Sutton | 759 | 102 | +467% | +84 | 13% |
| Maidstone | 897 | 116 | +176% | +74 | 13% |
| Ealing | 2,120 | 109 | +195% | +72 | 5% |
| Welwyn Hatfield | 427 | 77 | +756% | +68 | 18% |
| Kettering | 685 | 101 | +181% | +65 | 15% |
| Warwick | 960 | 103 | +134% | +59 | 11% |
| Wokingham | 1,014 | 148 | +59% | +55 | 15% |
| Uttlesford | 448 | 61 | +578% | +52 | 14% |
| Cornwall | 2,166 | 233 | +25% | +47 | 11% |
| Redbridge | 594 | 72 | +177% | +46 | 12% |
| Daventry | 420 | 69 | +188% | +45 | 16% |
| South Norfolk | 693 | 57 | +375% | +45 | 8% |
| Stratford-on-Avon | 1,065 | 106 | +68% | +43 | 10% |
| Wiltshire | 1,615 | 141 | +41% | +41 | 9% |
| Cherwell | 675 | 120 | +50% | +40 | 18% |
| Harborough | 538 | 73 | +115% | +39 | 14% |
| Northumberland | 385 | 50 | +285% | +37 | 13% |
| Camden | 558 | 55 | +175% | +35 | 10% |
| Lichfield | 273 | 35 | +3,400% | +34 | 13% |
| Cambridge | 566 | 119 | +38% | +33 | 21% |
| Cheshire East | 891 | 98 | +51% | +33 | 11% |
| East Hampshire | 708 | 63 | +103% | +32 | 9% |
| Elmbridge | 589 | 31 | n/a | +31 | 5% |
| Hounslow | 2,049 | 85 | +57% | +31 | 4% |
| Note: * ‘Sales effort’ = number of sales in 17/18 as a percentage of total LCHO stock in 17/18 Source: Regulator of Social Housing, Statistical Data Return 2017/18 | |||||
Shared ownership sales by RPs in local authority areas 2017/18: top 25 decreased sales
| First-tranche sales 2017/18 | |||||
|---|---|---|---|---|---|
| Change on 16/17 sales | |||||
| Local authority | LCHO less than 100 per cent equity number of units | Number | Percentage | Number | Sales effort percentage of stock* |
| Tower Hamlets | 3,025 | 114 | -71% | -275 | 4% |
| Wandsworth | 2,377 | 135 | -53% | -151 | 6% |
| Stevenage | 406 | 8 | -93% | -114 | 2% |
| Hackney | 2,646 | 32 | -76% | -100 | 1% |
| Waltham Forest | 1,460 | 77 | -56% | -100 | 5% |
| Barnet | 1,418 | 94 | -44% | -74 | 7% |
| Southampton | 972 | 10 | -88% | -71 | 1% |
| Bromley | 1,090 | 12 | -85% | -69 | 1% |
| Sunderland | 275 | 5 | -93% | -67 | 2% |
| Tewkesbury | 618 | 53 | -53% | -60 | 8.6% |
| Southwark | 2,991 | 215 | -21% | -56 | 7% |
| Telford and Wrekin | 479 | 20 | -73% | -54 | 4% |
| Wycombe | 652 | 8 | -85% | -47 | 1.2% |
| Leeds | 1,057 | 36 | -56% | -46 | 3% |
| Sevenoaks | 802 | 7 | -87% | -45 | 1% |
| Croydon | 1,899 | 51 | -46% | -43 | 3% |
| Sedgemoor | 238 | 11 | -80% | -43 | 5% |
| City of Bristol | 1,071 | 54 | -43% | -41 | 5% |
| Brighton & Hove | 865 | 3 | -93% | -38 | 0% |
| East Hertfordshire | 610 | 24 | -59% | -34 | 4% |
| Lambeth | 2,192 | 82 | -29% | -33 | 4% |
| Central Bedfordshire | 1,386 | 59 | -35% | -32 | 4% |
| Portsmouth | 733 | 18 | -64% | -32 | 2% |
| Milton Keynes | 5,389 | 125 | -19% | -29 | 2% |
| South Oxfordshire | 756 | 34 | -46% | -29 | 4% |
| Note: * ‘Sales effort’ = number of sales in 17/18 as a percentage of total LCHO stock in 17/18 Source: Regulator of Social Housing, Statistical Data Return 2017/18 | |||||
RELATED

News05 Mar 2025
Two Essex landlords in talks to merge by end of year
 funding boost")

News04 Mar 2025
North Yorkshire landlord raises £75m under guarantee scheme

- © Social Housing
- All rights reserved