Spending plans up 25% as housing association capital commitments increase across the board
Future commitments to capital works are up for almost all UK housing associations
UK housing associations plan to increase their spending on development, repairs and maintenance once again, according to the 2016/17 accounts of the largest organisations.
Their total capital commitments – that is, future spending on capital works that has either been awarded to a contractor or authorised by the board but not yet contracted – rose by a quarter in 2016/17 on the previous year, to reach more than £24bn.
The change is well ahead of the three per cent rise seen between 2014/15 and 2015/16 in last year’s report, although this used a slightly different cohort of associations.
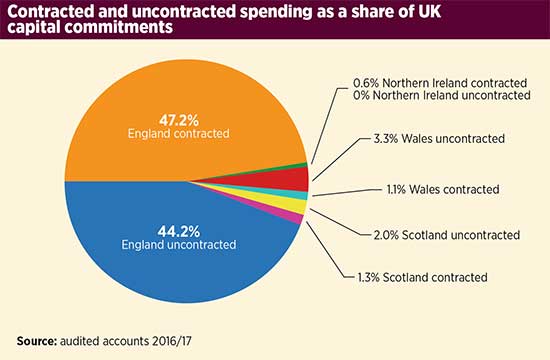
Spending that is authorised but not yet awarded to a contractor made up nearly half of total capital commitments in the UK – a rise of two percentage points – indicating increased opportunities for construction and maintenance firms to win work from housing associations. The total value of authorised but uncontracted expenditure rose 31 per cent to nearly £12bn thanks to the rise in total capital commitments.
Read more


The amount of contracted spending rose 19 per cent to more than £12bn.
The G15 group of London’s biggest housing associations has capital commitments of £9.7bn, which is 40 per cent of the UK total. Of this, 43 per cent of the group’s capital commitments are approved but not yet awarded to a contractor.
Spending plans have increased across all types of UK housing association except traditional associations in Wales, where they fell two per cent.
England increased its share of total UK spending to just over 90 per cent with slightly more than half that figure already awarded to contractors.
English associations increased their total capital commitments by a quarter in 2016/17. They authorised nearly £11bn of works not yet contracted and more than £11bn already awarded to firms.
The largest percentage increase in capital commitments was in Scotland at 62 per cent, where traditional associations upped their spending plans by nearly three quarters.
Capital commitments in Wales increased by 12 per cent, and by nine per cent in Northern Ireland. The rise in Northern Ireland turned around the previous year’s nine per cent drop, while Wales was also well ahead of the five per cent increase it saw in 2015/16’s report.
Our figures are based on the 2016/17 annual accounts and represent medium-term forward spend, typically of up to five years, although a few associations give spending plans over a longer period.
The figures are for contracted and agreed future investment, and do not take into account work in progress or completions for the year. The capital commitments for some housing associations include non-core activities such as development for market sale.
UK housing associations’ capital commitments 2016/17
| Authorised by board (not contracted) | Contracted | Total commitments | Authorised as a share of total commitments | |||||||
|---|---|---|---|---|---|---|---|---|---|---|
| Number of housing associations | Type of housing association | Number of units, ’000s | Total, £m | Change on year | Total, £m | Change on year | Total, £m | Change on year | 2016/17 | 2015/16 |
| England | ||||||||||
| 61 | LSVT | 783 | 1,434 | -6% | 2,306 | +17% | 3,740 | +7% | 38% | 44% |
| 48 | Mixed | 1,587 | 6,998 | +41% | 7,776 | +32% | 14,774 | +36% | 47% | 46% |
| 58 | Traditional | 465 | 2,252 | +36% | 1,338 | -22% | 3,585 | +7% | 63% | 49% |
| 167 | Total England | 2,835 | 10,685 | +31% | 11,420 | +19% | 22,099 | +25% | 48% | 46% |
| Scotland | ||||||||||
| 21 | Traditional | 95 | 344 | +104% | 198 | +26% | 618 | +73% | 56% | 47% |
| 5 | LSVT | 29 | 58 | +40% | 32 | +98% | 90 | +57% | 64% | 72% |
| 1 | Wheatley Group | 51 | 81 | +120% | 79 | +54% | 160 | +34% | 51% | 57% |
| 27 | Total Scotland | 175 | 483 | +74% | 309 | +38% | 868 | +62% | 56% | 52% |
| Wales | ||||||||||
| 19 | Traditional | 85 | 214 | -5% | 245 | -1% | 459 | -2% | 47% | 48% |
| 5 | LSVT | 46 | 577 | +28% | 30 | -6% | 607 | +25% | 95% | 93% |
| 24 | Total Wales | 131 | 792 | +17% | 274 | -1% | 1,066 | +12% | 74% | 71% |
| Northern Ireland | ||||||||||
| 5 | Total Northern Ireland | 36 | 0 | +0% | 142 | +9% | 142 | +9% | 0% | 0% |
| 223 | Total UK | 3,177 | 11,959 | +31% | 12,145 | +19% | 24,175 | +25% | 49% | 47% |
Source: audited accounts 2016/17
England
Once again, mixed groups had the largest capital commitments of the three types of association in England, making up 67 per cent of the country’s total spending plans. They also saw the biggest rise in planned spending at 36 per cent. This is unsurprising, as many are active developers and many make more than a quarter of their income from activities other than social rented housing activities, such as build for sale or shared ownership.
The share of total spending authorised but not yet contracted by mixed groups held steady at 47 per cent.
Traditional housing associations and stock transfers (LSVTs) only saw their total spending plans rise by seven per cent, but the opportunities for contractors increased at traditional associations, as the share of total commitments that has been approved but not awarded to a firm rose to 63 per cent. However, LSVTs moved in the opposite direction with a six percentage point fall in spending not yet contracted to £1.4bn.
The Homes and Communities Agency’s (HCA) Global Accounts for 2017 said that most of the providers with more than 1,000 homes – a slightly different group to that included in this report – have cut costs to cope with the rent reduction. The largest cuts were on major repairs expenditure, which fell 14 per cent to £2.1bn in 2017. The report said the greatest reductions in spending on major repairs had been made by more recent stock transfer providers, which may reflect that they have moved beyond the initial phase of intensive catch-up repair work after the transfer.
However, the HCA said that forecasts suggest that major repairs spending will increase in the three remaining years of rent reductions up to 2020.
The sector increased its spending on development in 2017, the HCA’s report said. It spent £7.9bn on new or existing social housing for rent – a rise of £400m. Money spent on the development of new properties rose from £5.6bn in 2016 to £6.3bn in 2017. The sector also invested about £3.2bn on properties developed for outright sale and the expected first tranche element of shared ownership properties. The value of investment properties – a category which includes homes for market rent or held for other non-social housing purposes – rose by £700m, with £500m of that attributable to the development of new homes.
UK housing associations' capital commitments 2016/17: top 60
| Authorised commitments share of total commitments | ||||||
|---|---|---|---|---|---|---|
| Number of units | Total, £m | Change on year | 2016/17 | 2015/16 | Total commitments as a percentage of turnover, 2016/17 | |
| L&Q | 90,571 | 2,249 | +39% | 34% | 37% | 297% |
| Clarion | 124,878 | 1,186 | +64% | 41% | 70% | 149% |
| Hyde | 49,160 | 1,143 | +42% | 53% | 45% | 362% |
| Notting Hill | 32,791 | 1,065 | +162% | 25% | 31% | 259% |
| A2 Dominion | 36,739 | 908 | +43% | 54% | 54% | 244% |
| Orbit | 40,610 | 837 | -10% | 52% | 49% | 251% |
| Family Mosaic | 25,838 | 734 | +24% | 65% | 18% | 277% |
| Places for People | 182,725 | 723 | +39% | 95% | 94% | 95% |
| Metropolitan | 37,505 | 714 | +102% | 29% | 63% | 269% |
| Home | 55,516 | 713 | +62% | 78% | 83% | 202% |
| Sanctuary | 99,481 | 711 | +165% | 88% | 59% | 106% |
| Trivallis (RCT) | 10,803 | 525 | +31% | 99% | 96% | 1,055% |
| Peabody | 29,266 | 510 | +62% | 83% | 67% | 174% |
| One | 16,224 | 365 | -17% | 28% | 42% | 143% |
| Southern | 27,540 | 355 | +10% | 66% | 49% | 178% |
| Sovereign | 55,791 | 344 | +9% | 23% | 35% | 92% |
| Network | 20,649 | 284 | +7% | 0 | 0 | 127% |
| Aster | 29,219 | 277 | +69% | 32% | 16% | 146% |
| Sentinel | 101,16 | 263 | +100% | 10% | 25% | 332% |
| ForViva Group | 17,666 | 261 | +219% | 95% | 76% | 228% |
| Moat | 20,494 | 246 | +77% | 13% | 12% | 203% |
| BPHA | 18,186 | 244 | +38% | 53% | 45% | 199% |
| Genesis | 32,080 | 232 | +7% | 0 | 0 | 88% |
| Waterloo | 26,867 | 222 | +4% | 41% | 57% | 165% |
| Amicus Horizon | 25,858 | 217 | +74% | 51% | 47% | 115% |
| Thirteen | 33,605 | 197 | +135% | 76% | 37% | 119% |
| Newlon | 7,782 | 191 | +64% | 52% | 81% | 206% |
| Swan | 10,868 | 182 | -4% | 0 | 0 | 179% |
| DCH | 23,579 | 179 | +6% | 27% | 47% | 128% |
| Great Places | 18,908 | 174 | +64% | 77% | 48% | 159% |
| Paradigm | 14,231 | 168 | +1% | 32% | 13% | 123% |
| Hightown | 5,386 | 162 | +9% | 54% | 29% | 259% |
| Radian | 24,241 | 162 | +108% | 27% | 35% | 118% |
| Wheatley | 51,477 | 160 | +34% | 51% | 57% | 58% |
| Sanctuary Scotland | 6,513 | 159 | +48% | 77% | 72% | 688% |
| Stonewater | 30,853 | 148 | -4% | 36% | 19% | 82% |
| Cross Keys Homes | 10,840 | 139 | +24% | 35% | 13% | 213% |
| Thames Valley | 15,466 | 138 | +12% | 0 | 15% | 127% |
| The Extracare Charitable Trust | 4,020 | 138 | -24% | 33% | 68% | 161% |
| Bromford | 29,510 | 133 | +5% | 24% | 36% | 80% |
| Catalyst | 21,153 | 125 | -50% | 52% | 49% | 74% |
| Longhurst | 18,928 | 121 | +5% | 15% | 19% | 109% |
| Origin | 6,588 | 119 | +23% | 83% | 81% | 201% |
| Housing & Care 21 | 19,589 | 118 | +153% | 81% | 77% | 58% |
| Rooftop | 6,579 | 118 | +103% | 67% | 78% | 314% |
| Poplar Harca | 8,903 | 110 | +131% | 80% | 13% | 186% |
| Torus | 21,592 | 110 | +222% | 70% | 68% | 101% |
| Knightstone | 12,436 | 102 | -43% | 76% | 81% | 128% |
| Hanover (Scotland) | 5,355 | 102 | +900% | 96% | 0 | 288% |
| Aldwyck | 10,752 | 100 | +27% | 65% | 68% | 108% |
| Greenfields Community | 8,401 | 98 | +43% | 45% | 48% | 229% |
| Wandle | 7,299 | 95 | -26% | 60% | 64% | 166% |
| Adactus | 13,880 | 95 | -22% | 63% | 56% | 128% |
| Guinness | 66,684 | 91 | -42% | 13% | 38% | 21% |
| Yorkshire | 16,516 | 89 | -32% | 74% | 45% | 89% |
| Chelmer Housing | 9,406 | 89 | -20% | 44% | 49% | 142% |
| ISHA | 2,297 | 89 | +216% | 61% | 41% | 426% |
| Midland Heart | 33,513 | 88 | +190% | 13% | 59% | 43% |
| Central & Cecil | 2,064 | 83 | +241% | 98% | 92% | 281% |
| Paragon | 9,050 | 82 | +15% | 44% | 18% | 114% |
| Curo | 13,288 | 81 | +139% | 25% | 24% | 83% |
Source: audited accounts 2016/17
Individual associations
For the third year running L&Q had the largest programme of planned capital spending at £2.2bn, up 39 per cent on the previous year. Just over a third of this is not yet allocated to a contractor.
It plans to finance the £1.5bn of contracted works almost entirely through surpluses and borrowings (just over £1.3bn), with £138m of grant making up the difference. In addition to its capital commitments, it has a development pipeline of 44,300 units over 16 years costing £4.6bn, which again is almost all funded through surpluses and borrowings.
L&Q’s programme was more than £1bn larger than that of Clarion, which had the second-largest spending plans at nearly £1.2bn. Clarion, which is newly formed from the merger of Affinity Sutton and Circle, increased its capital spending plans by 64 per cent in 2017, but had a smaller share that was not yet committed to a contractor.
Its annual accounts said the spending was mainly on the construction of new homes. It had £72m that was contracted in its joint ventures with the exception of Linden/Downland Graylingwell, for which it said it had an extra £34.7m authorised but not contracted and would use sales receipts from earlier phases of the scheme to fund further units. It had £168.5m of cash and equivalents, £812m of undrawn funding and also said it would use future surpluses and debt to fund the commitments.
Notting Hill moved up to fourth place after increasing its spend by 162 per cent to more than £1bn. The majority of this is already contracted. The group’s accounts said it will use sales receipts of £765.2m, grant of £53.4m and existing loans of £357m to fund its capital commitments, which exclude land purchases. It plans to build around 7,000 homes in greater London over the next five years.
It said it had reduced its repairs and maintenance costs per home from £2,002 in 2014/15 to £1,781 in 2016/17, mainly by saving money on unit prices within contracts that began in April 2015 and through delays to planned maintenance.
As was the case in 2016, the remaining places in the top six spenders were taken by Hyde, Orbit and A2 Dominion.
The figures of some of the associations spending the most on capital commitments underline the importance of sales proceeds to funding the work. For example, Orbit planned to use £540m of sales proceeds, £276m of debt and reserves, and £21.8m of grant to fund its £837m programme of capital commitments.
Hyde also planned to fund most of its £1.1bn capital commitments through property sales of £810m, with a loan of £311m and grants of £22m also contributing.
A2 Dominion planned to use grants, sales proceeds from market and first tranche sales of more than £1bn, and undrawn loan facilities of £358.3m to fund its capital commitments of over £900m. It had 5,402 homes in development in 2017.
UK housing associations' authorised (not contracted) capital commitments: largest year-on-year changes
| Authorised commitments, share of total commitments | ||||||
|---|---|---|---|---|---|---|
| Top 30 increased | Number of units | Authorised total, £m | Change on year, £m | 2016/17 | 2015/16 | Authorised as a percentage of turnover, 2016/17 |
| Sanctuary | 99,481 | 629 | +472 | 88% | 59% | 94% |
| Family Mosaic | 25,838 | 478 | +372 | 65% | 18% | 180% |
| Hyde | 49,160 | 607 | +244 | 53% | 45% | 192% |
| Peabody | 29,266 | 421 | +211 | 83% | 67% | 144% |
| Places for People | 182,725 | 689 | +201 | 95% | 94% | 91% |
| Home | 55,516 | 554 | +187 | 78% | 83% | 157% |
| ForViva Group | 17,666 | 248 | +185 | 95% | 76% | 216% |
| L&Q | 90,571 | 771 | +176 | 34% | 37% | 102% |
| A2 Dominion | 36,739 | 493 | +153 | 54% | 54% | 133% |
| Trivallis (RCT) | 10,803 | 521 | +137 | 99% | 96% | 1,047% |
| Notting Hill | 32,791 | 262 | +136 | 25% | 31% | 64% |
| Thirteen | 33,605 | 149 | +118 | 76% | 37% | 90% |
| Hanover (Scotland) | 5,355 | 98 | +98 | 96% | 0 | 276% |
| Great Places | 18,908 | 134 | +83 | 77% | 48% | 122% |
| Poplar Harca | 8,903 | 88 | +81 | 80% | 13% | 148% |
| Southern | 27,540 | 236 | +78 | 66% | 49% | 118% |
| Aster | 29,219 | 90 | +64 | 32% | 16% | 47% |
| Housing & Care 21 | 19,589 | 96 | +60 | 81% | 77% | 47% |
| Central & Cecil | 2,064 | 81 | +59 | 98% | 92% | 275% |
| Broadland | 5,014 | 67 | +58 | 97% | 91% | 244% |
| Torus | 21,592 | 77 | +54 | 70% | 68% | 71% |
| Amicus Horizon | 25,858 | 111 | +52 | 51% | 47% | 59% |
| BPHA | 18,186 | 128 | +48 | 53% | 45% | 105% |
| Sanctuary Scotland | 6,513 | 123 | +46 | 77% | 72% | 532% |
| Hightown | 5,386 | 87 | +44 | 54% | 29% | 139% |
| Octavia | 4,826 | 57 | +43 | 77% | 45% | 127% |
| ISHA | 2,297 | 54 | +42 | 61% | 41% | 258% |
| Your | 33,277 | 43 | +41 | 100% | 15% | 23% |
| Cross Keys Homes | 10,840 | 48 | +34 | 35% | 13% | 74% |
| Rooftop | 6,579 | 79 | +33 | 67% | 78% | 210% |
| Authorised commitments, share of total commitments | ||||||
|---|---|---|---|---|---|---|
| Top 30 decreased | Number of units | Authorised total, £m | Change on year, £m | 2016/17 | 2015/16 | Authorised as a percentage of turnover, 2016/17 |
| The Community Housing Group | 6,834 | 28 | -368 | 87% | 97% | 73% |
| One | 16,224 | 101 | -82 | 28% | 42% | 39% |
| The Extracare Charitable Trust | 4,020 | 46 | -78 | 33% | 68% | 54% |
| Knightstone | 12,436 | 77 | -67 | 76% | 81% | 97% |
| Catalyst | 21,153 | 65 | -58 | 52% | 49% | 39% |
| Wrekin | 13,536 | 11 | -48 | 17% | 42% | 14% |
| Guinness | 66,684 | 12 | -47 | 13% | 38% | 3% |
| Sovereign | 55,791 | 79 | -32 | 23% | 35% | 21% |
| Waterloo | 26,867 | 91 | -31 | 41% | 57% | 68% |
| Trafford | 8,897 | 0 | -31 | 0 | 56% | 0 |
| Richmond Housing | 10,083 | 4 | -31 | 6% | 84% | 6% |
| DCH | 23,579 | 49 | -31 | 27% | 47% | 35% |
| First Wessex | 19,206 | 32 | -30 | 48% | 53% | 25% |
| Wandle | 7,299 | 57 | -25 | 60% | 64% | 100% |
| Orbit | 40,610 | 432 | -20 | 52% | 49% | 129% |
| Thames Valley | 15,466 | 0 | -18 | 0 | 15% | 0 |
| Cardiff Community | 2,943 | 19 | -18 | 44% | 86% | 103% |
| Asra | 14,543 | 17 | -18 | 46% | 32% | 19% |
| Coastal | 5,569 | 30 | -18 | 67% | 59% | 94% |
| Pembrokeshire | 2,617 | 16 | -18 | 60% | 68% | 68% |
| Clarion | 124,878 | 491 | -17 | 41% | 70% | 62% |
| Hanover | 18,780 | 19 | -17 | 68% | 54% | 16% |
| Axiom | 2,268 | 14 | -17 | 85% | 100% | 78% |
| Bracknell Forest | 7,251 | 3 | -17 | 7% | 42% | 7% |
| WM | 30,715 | 9 | -16 | 14% | 40% | 6% |
| Nottingham Community | 9,224 | 23 | -16 | 50% | 63% | 28% |
| Chelmer Housing | 9,406 | 39 | -15 | 44% | 49% | 63% |
| Bromford | 29,510 | 32 | -14 | 24% | 36% | 19% |
| Plymouth Community | 15,779 | 13 | -14 | 26% | 56% | 20% |
| Hillcrest | 7,162 | 6 | -13 | 22% | 42% | 12% |
Sanctuary had the largest increase in capital commitments that were authorised but not awarded to a contractor in 2017 of £472m. It said £55.7m of its total £711.1m capital commitments programme would be funded by grant and other public finance, and the rest would come from the group’s surplus.
Family Mosaic, which is now part of Peabody, saw the second-largest rise in its authorised but uncontracted commitments, said grants of £48.8m would support its commitments of £733.6m, with cash flows, existing and new loans and sales proceeds supporting the rest. It has a development pipeline of 3,725 homes and plans to build a small portfolio of private rented properties.
The Community Housing Group had the largest fall in capital commitments. It had an authorised but uncontracted spend of nearly £396m in 2016, which fell to £28m in 2017. While it had planned to fund all its 2016 capital spending from more than £409m of loans, in 2017 it planned to use £16m of debt, £11m of sales income and £4.4m of grant to do so. It had extended its development programme in 2016 to deliver 634 homes.
One Housing Group decreased its spending that was approved but not contracted and its contracted spend on joint ventures, but increased its contracted construction spend, which covers purchase, development, repairs and maintenance. It increased the amount of money it planned to get from grant, loans and reserves but there was a sharp decrease in the amount of sales proceeds it planned to use to fund capital commitments, from £194m in 2016 to £64m in 2017.
The top 10 associations with the largest capital commitments was made up of G15 members based in London and four national organisations (Places for People, Home, Orbit and Sanctuary). Welsh association RCT Homes, now called Trivallis, appeared at number 12 because it included the organisation’s 15-year VAT shelter capital spend to 2023 of £76.2m and its 30-year capital spending to 2045 of £445.2m.
ForViva, based in the North West, is made up of Villages Housing Association and City West Housing Trust, plus its construction company ForWorks. It was the only purely Northern organisation in the 20 with the biggest capital commitments. Five of the seven members of Homes for the North – Great Places, Guinness, Home Group, and Thirteen – were in the 60 UK associations with the biggest capital commitments.
London G15 capital commitments 2016/17
| Authorised commitments, share of total commitments | ||||||
|---|---|---|---|---|---|---|
| Number of units | Total, £m | Change on year | 2016/17 | 2015/16 | Total commitments as a percentage of turnover, 2016/17 | |
| A2 Dominion | 36,739 | 908 | +43% | 54% | 54% | 244% |
| Amicus Horizon | 25,858 | 217 | +74% | 51% | 47% | 115% |
| Catalyst | 21,153 | 125 | -50% | 52% | 49% | 74% |
| Clarion | 124,878 | 1,186 | +64% | 41% | 70% | 149% |
| Family Mosaic | 25,838 | 734 | +24% | 65% | 18% | 277% |
| Genesis | 32,080 | 232 | +7% | 0 | 0 | 88% |
| Hyde | 49,160 | 1,143 | +42% | 53% | 45% | 362% |
| L&Q | 90,571 | 2,249 | +39% | 34% | 37% | 297% |
| Metropolitan | 37,505 | 714 | +102% | 29% | 63% | 269% |
| Network | 20,649 | 284 | +7% | 0 | 0 | 127% |
| Notting Hill | 32,791 | 1,065 | +162% | 25% | 31% | 259% |
| Peabody | 29,266 | 510 | +62% | 83% | 67% | 174% |
| Southern | 27,540 | 355 | +10% | 66% | 49% | 178% |
Scotland
Of the UK countries, Scotland had the biggest rise in its capital commitments of 62 per cent. It also had by far the largest rise in commitments that were authorised by the board but not allocated to a contractor. Contracted spending rose by 38 per cent. Authorised spending as a share of total capital commitments rose slightly to 56 per cent.
Both traditional associations and Scotland’s largest association, Wheatley Group, more than doubled their spending on authorised but uncontracted commitments. LSVTs almost doubled their contracted commitments, while traditionals saw theirs rise by over a quarter and Wheatley’s by more than half.
Wheatley said it had enough cash or bank lending to meet its capital commitments.
Wales
The Welsh associations in the report increased their capital commitments by 12 per cent. LSVTs upped their capital commitments by a quarter, but traditional associations saw them fall by two per cent. Contracted spending fell for both traditional and LSVTs, as did authorised but uncontracted spending plans for traditional associations. However, LSVTs’ uncontracted spending rose 28 per cent.
Stock transfer association Trivallis, which had the 12th-largest capital commitment plans in the UK, planned to fund them through a £113m loan from Lloyds Bank, gap funding of £7.3m a year from the Welsh government and rental income.
Northern Ireland
Once again, all the capital commitments of the five Northern Irish associations in the report had been allocated to contractors. Spending rose nine per cent to £142m.
Future prospects
Figures from the Ministry of Housing, Communities and Local Government show that housing starts by housing associations in 2016/17 were up nearly four per cent to 25,550. They rose 70 per cent in Scotland to 4,950 and fell 23 per cent in Northern Ireland to 1,000. Wales no longer provides starts figures for housing associations because of confusion by building control departments over whether a home was being built for a housing association or for a private company which had led to misreporting.
The 2017 accounts end before the Grenfell Tower fire happened in June 2017. As a result of the disaster some housing associations will need to undertake remediation work on existing stock, so the 2018 accounts may show this additional spending.
The HCA is also keeping an eye on associations to check that those that cut back on repairs and maintenance spending to mitigate the effects of the rent reduction are maintaining their homes sufficiently. In its sector risk profile for 2017 it warned that a lack of investment in existing properties can store up problems for the future and make properties harder to let.
RELATED

News10 Mar 2025
Community Housing hires interim chief financial officer

News05 Mar 2025
Two Essex landlords in talks to merge by end of year
 funding boost")

- © Social Housing
- All rights reserved